Content marketing budgets are under more scrutiny than at any point in the past decade – and defending those budgets to a CFO is one of the core operational disciplines of our digital marketing company in Kolkata. As economic pressure forces marketing leaders to justify every line item, “we’re building brand awareness” is no longer a sufficient answer for a program that consumes significant time, headcount, and production budget. The challenge is that content marketing’s value is real but distributed, it operates across the entire customer journey, influences decisions that get attributed to other channels, and produces compounding returns that do not show up in the same reporting period as the investment.
The result is a persistent measurement gap. Most businesses know their content marketing program is doing something, traffic is growing, social engagement is up, sales teams reference blog posts in conversations, but they cannot translate that activity into a number that appears on a revenue report. That gap is not a measurement problem; it is a framework problem. Content marketing ROI becomes measurable when you replace activity-based reporting with outcome-based reporting, build the attribution infrastructure to connect content to revenue, and establish the right time horizon for evaluating returns.
This guide gives marketing leaders, content strategists, and growth teams a practical system for measuring content marketing ROI, from the infrastructure required to the metrics that matter to the reporting frameworks that translate content performance into language that finance and leadership teams understand.
Why Most Content ROI Calculations Fail
The most common approach to measuring content marketing ROI is to calculate cost per piece of content, divide it by traffic or engagement generated, and present a cost-per-visit or cost-per-lead figure. This approach has two fundamental problems: it treats all traffic as equal regardless of intent or quality, and it measures efficiency rather than value.
A blog post that generates 50,000 visits from informational searchers who never convert has a lower cost-per-visit than a post that generates 500 visits from buyers actively evaluating your product, but the 500-visit post generates exponentially more revenue – which is why every content brief that leaves our technical SEO team carries an intent stage and a revenue target tied to it. Averaging across all content types, traffic qualities, and funnel stages yields a number that is technically accurate but strategically useless.
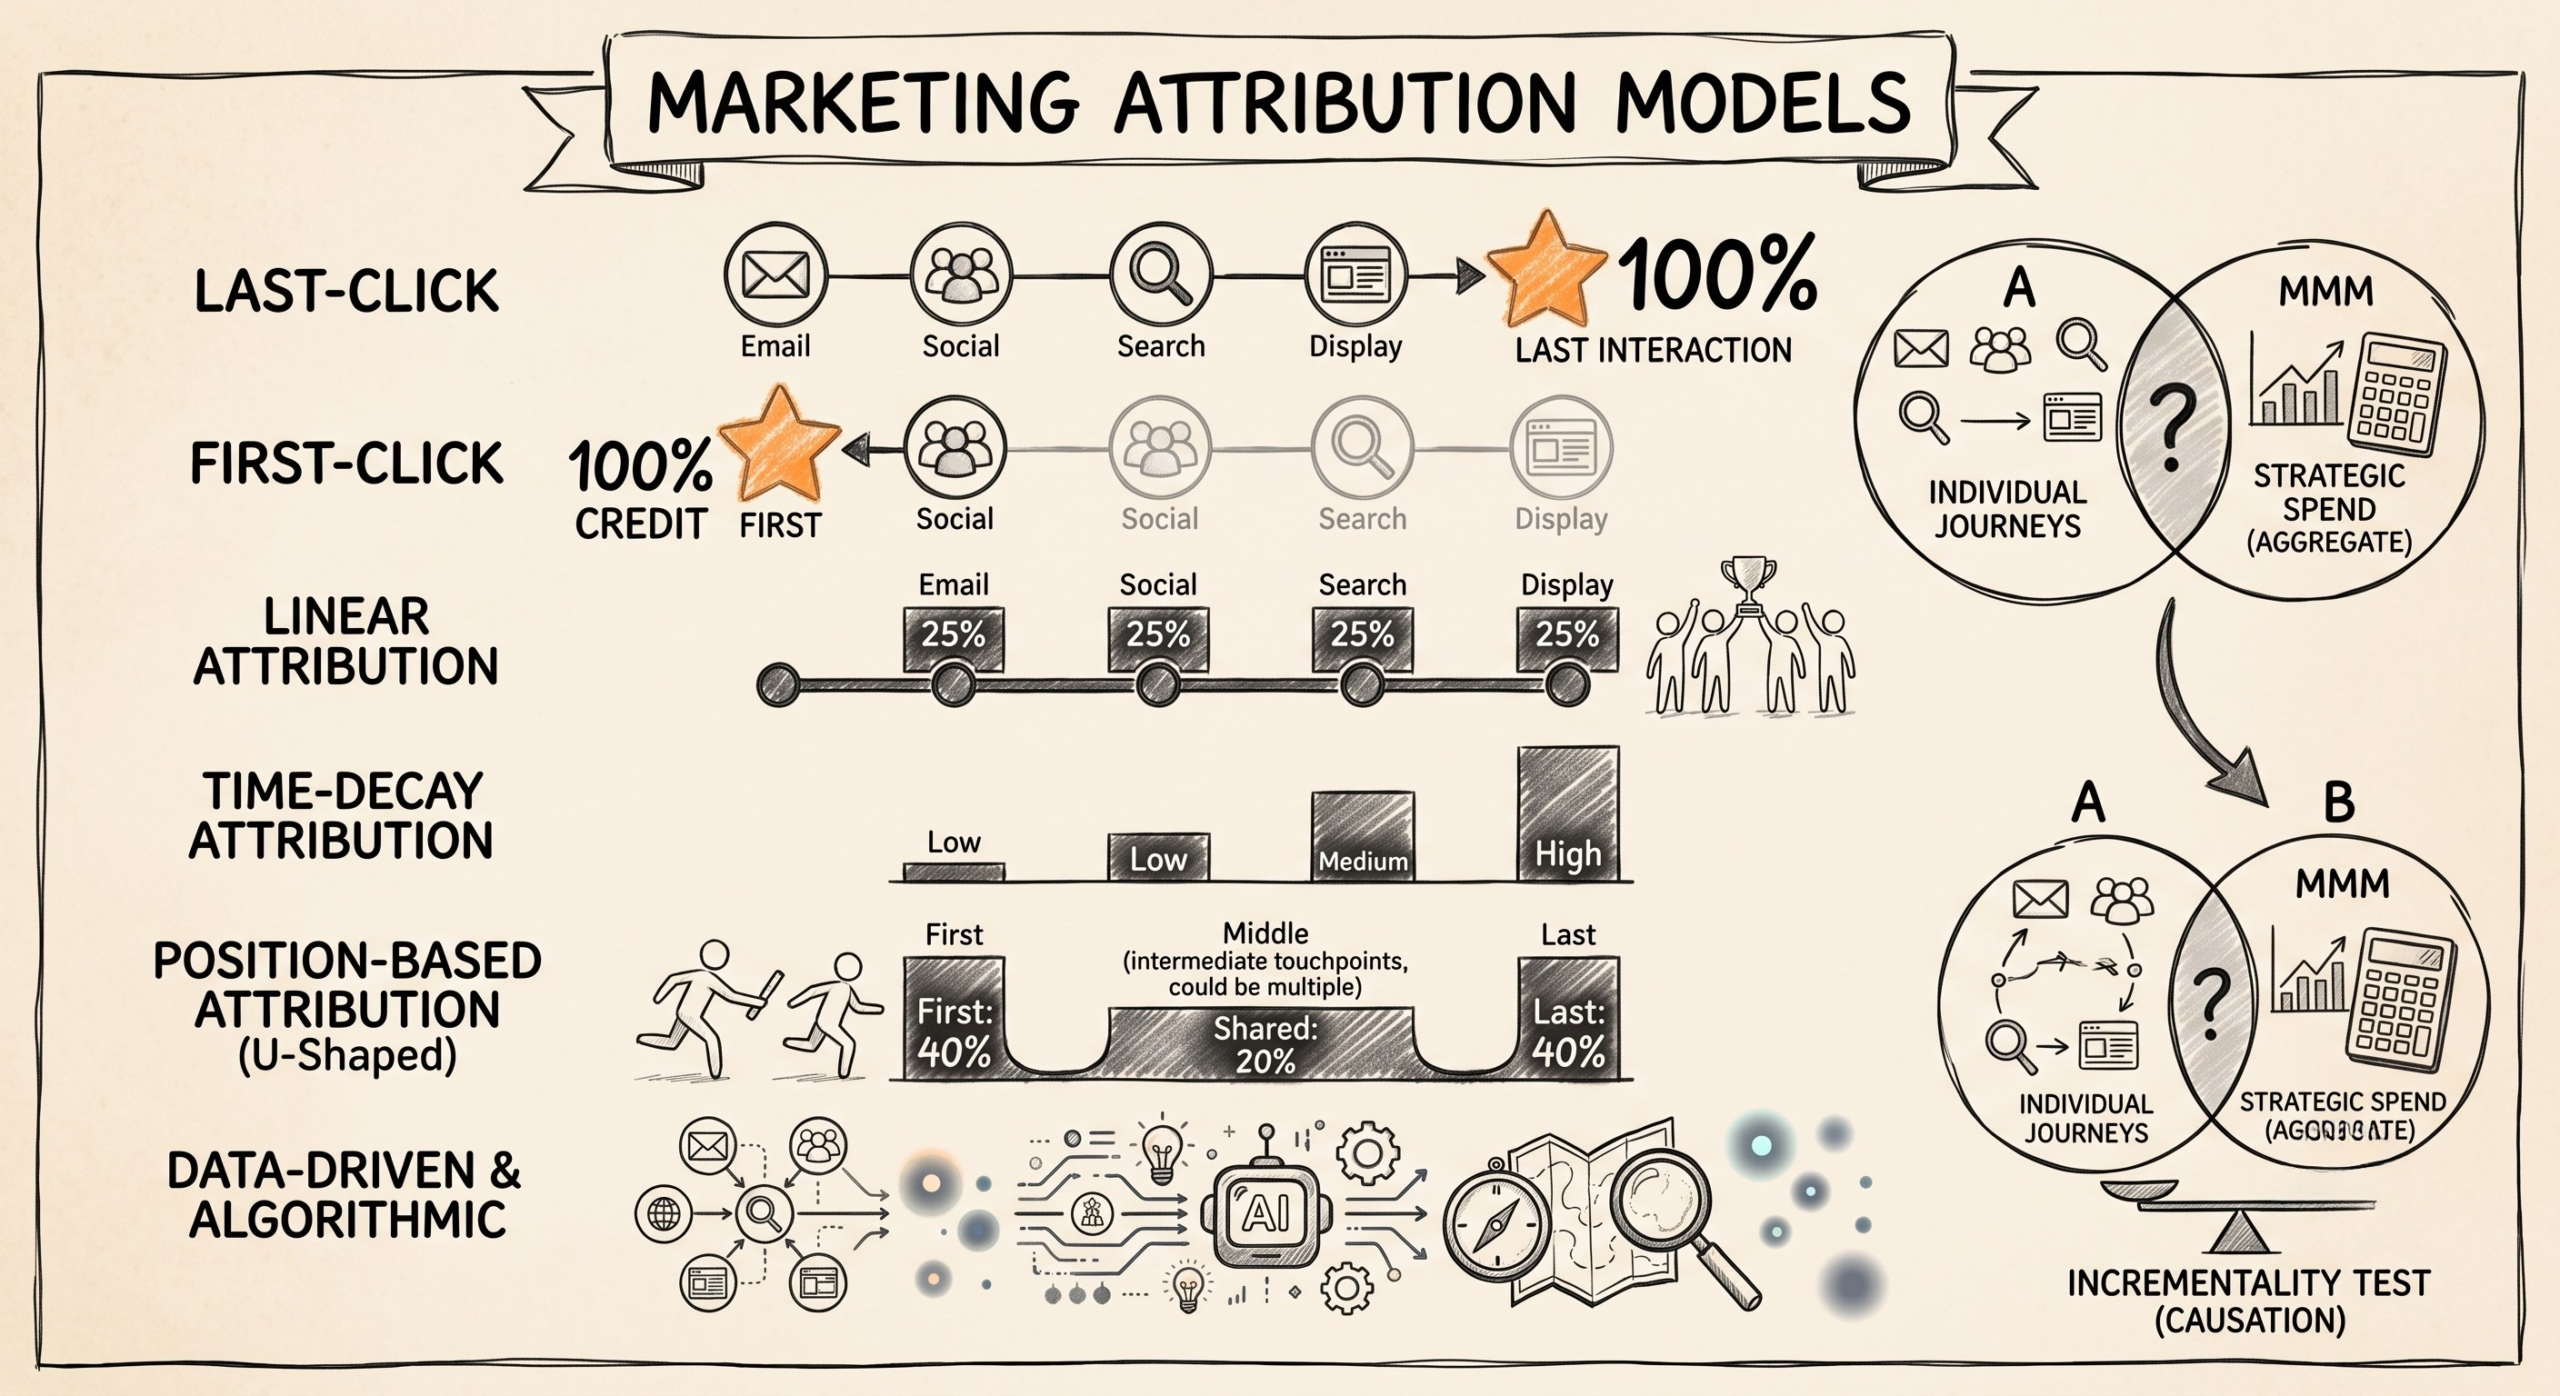
The second failure mode is attribution. Last-click attribution, still the default in Google Analytics and most CRM systems, assigns conversion credit to the final touchpoint before a sale – systematically underreporting the creative and content investments that built trust earlier in the journey, work delivered by our creative content team in Kolkata for every retained content programme. In a typical B2B buying journey, that final touchpoint is often a branded search, a sales email, or a retargeting ad. The content that educated the buyer, built trust in the brand, and initiated the search never receives credit in a last-click model. Content’s contribution is systematically underreported, which leads to systematic underinvestment.
The third failure mode is the time horizon. Content marketing compounds. A well-optimised piece of content published today may generate minimal returns in month one and significant returns in month twelve as it accumulates backlinks, climbs search rankings, and gets discovered by progressively larger audiences. Evaluating content ROI on a 30 or 90-day cycle, the same cadence used for paid advertising, will always make content look worse than it is relative to channels with immediate but non-compounding returns.
Solving all three failure modes requires a different measurement architecture, not a better spreadsheet.
The wider pattern of structural content errors that produce these measurement gaps is documented in our breakdown of the content marketing mistakes businesses make.
Build the Attribution Infrastructure Before You Measure Anything
Measurement accuracy is directly proportional to tracking infrastructure. Before any content ROI analysis is meaningful, three infrastructure elements must be in place: UTM parameter discipline, CRM content attribution fields, and a defined conversion event taxonomy.
UTM parameters should be applied to every link that drives traffic from content to a conversion destination, every email newsletter link, every social media post link, and every internal CTA within blog content. The UTM structure should capture source (the platform or channel), medium (the content type), and campaign (the specific piece or series). Without this, your analytics platform cannot distinguish between traffic from a LinkedIn article, a Twitter share of the same article, and a direct link in an email, three sources with very different intent profiles and conversion rates.
CRM content attribution means recording which content a lead or customer interacted with before converting, and at what stage of their journey. This requires either a marketing automation platform with content tracking (HubSpot, Marketo, Pardot all support this natively) or a custom implementation that passes UTM data into lead records at the point of form submission. The output is a database of customer journeys that shows which content assets appear most frequently in the paths that lead to closed revenue.
Conversion event taxonomy is a defined hierarchy of actions that indicate progression through the funnel, from content engagement (time on page, scroll depth, return visit) to micro-conversions (newsletter subscription, content download, free trial signup) to macro-conversions (qualified lead, sales opportunity, closed customer). Without a defined taxonomy, ROI calculations conflate events of very different commercial value and produce figures that cannot be acted upon.
With these three elements in place, the analysis becomes a matter of querying data that already exists rather than reconstructing customer journeys retrospectively.
The Metrics That Actually Reflect Content Marketing Value
Once attribution infrastructure is in place, the metrics worth tracking fall into three categories: pipeline contribution metrics, efficiency metrics, and compounding value metrics. Each answers a different business question.
Pipeline contribution metrics connect content directly to revenue outcomes. Content-influenced revenue measures the total closed revenue from customers who interacted with at least one piece of content before purchasing. Content-sourced revenue measures closed revenue from customers whose first known touchpoint was a content asset. Content-assisted opportunities measure the number of active sales pipeline opportunities where a prospect consumed content during the evaluation phase. These metrics appear in the same reports as paid channel performance and allow direct comparison of content ROI against advertising spend.
Efficiency metrics measure how well your content program converts investment into output. Cost per content-sourced lead compares the total content program cost (production, distribution, tool costs, personnel time) against the number of leads whose first touchpoint was content. Cost per content-influenced customer applies the same logic to closed revenue. These figures become more meaningful over time as you can track how efficiency improves as content accumulates domain authority, organic rankings, and audience familiarity.
Compounding value metrics capture the returns that accrue over time and are unique to content as an asset class. Organic search traffic growth measures the cumulative audience your content is building through search rankings, an audience that costs nothing to reach after the initial content production investment. Backlink acquisition tracks the domain authority growth generated by content that other sites reference, which improves the ranking potential of future content. Email subscriber growth from content measures the owned audience your content program is building, an asset that reduces future distribution costs.
The combination of pipeline metrics (to satisfy finance and leadership), efficiency metrics (to optimize internal resource allocation), and compounding metrics (to demonstrate long-term strategic value) gives content leaders a complete ROI picture rather than a single number that oversimplifies a complex program.
Multi-Touch Attribution: Giving Content Its Proper Credit
Moving from last-click to multi-touch attribution is the single highest-impact change most businesses can make to their content marketing ROI measurement. It does not require new tools in many cases, it requires a deliberate decision to use attribution models that already exist in most analytics and CRM platforms, but are not set as defaults.
Position-based attribution (also called U-shaped attribution) assigns 40% of conversion credit to the first content touchpoint, 40% to the last touchpoint before conversion, and distributes the remaining 20% across intermediate touchpoints. This model reflects the reality that first impressions and final decisions are both consequential, while still acknowledging the supporting role of content consumed in between. For content programs that focus on top-of-funnel awareness and consideration, this model will substantially increase measured content contribution relative to last-click.
Time-decay attribution assigns more credit to touchpoints closer to the conversion date, on the assumption that recent interactions are more causally related to the purchase decision. This model tends to undervalue awareness content and overvalue conversion-stage content, a useful counterbalance in organizations where awareness content has been historically overinvested relative to conversion content.
Linear attribution distributes credit equally across all touchpoints in the customer journey. It is the most conservative model for content programs and the easiest to explain to non-marketing stakeholders. For organizations just beginning to move away from last-click attribution, linear attribution is a defensible starting point that immediately reveals content’s presence in customer journeys without making complex causal claims.
The practical recommendation is to run multiple attribution models in parallel for the first two quarters after implementation, then select the model that most accurately reflects the buying behavior your sales team observes qualitatively. Attribution models are hypotheses about causality, the best model for your business is the one that most closely matches how your customers actually make decisions, not the one that produces the most favourable content ROI number.
Calculating Content ROI: A Working Formula
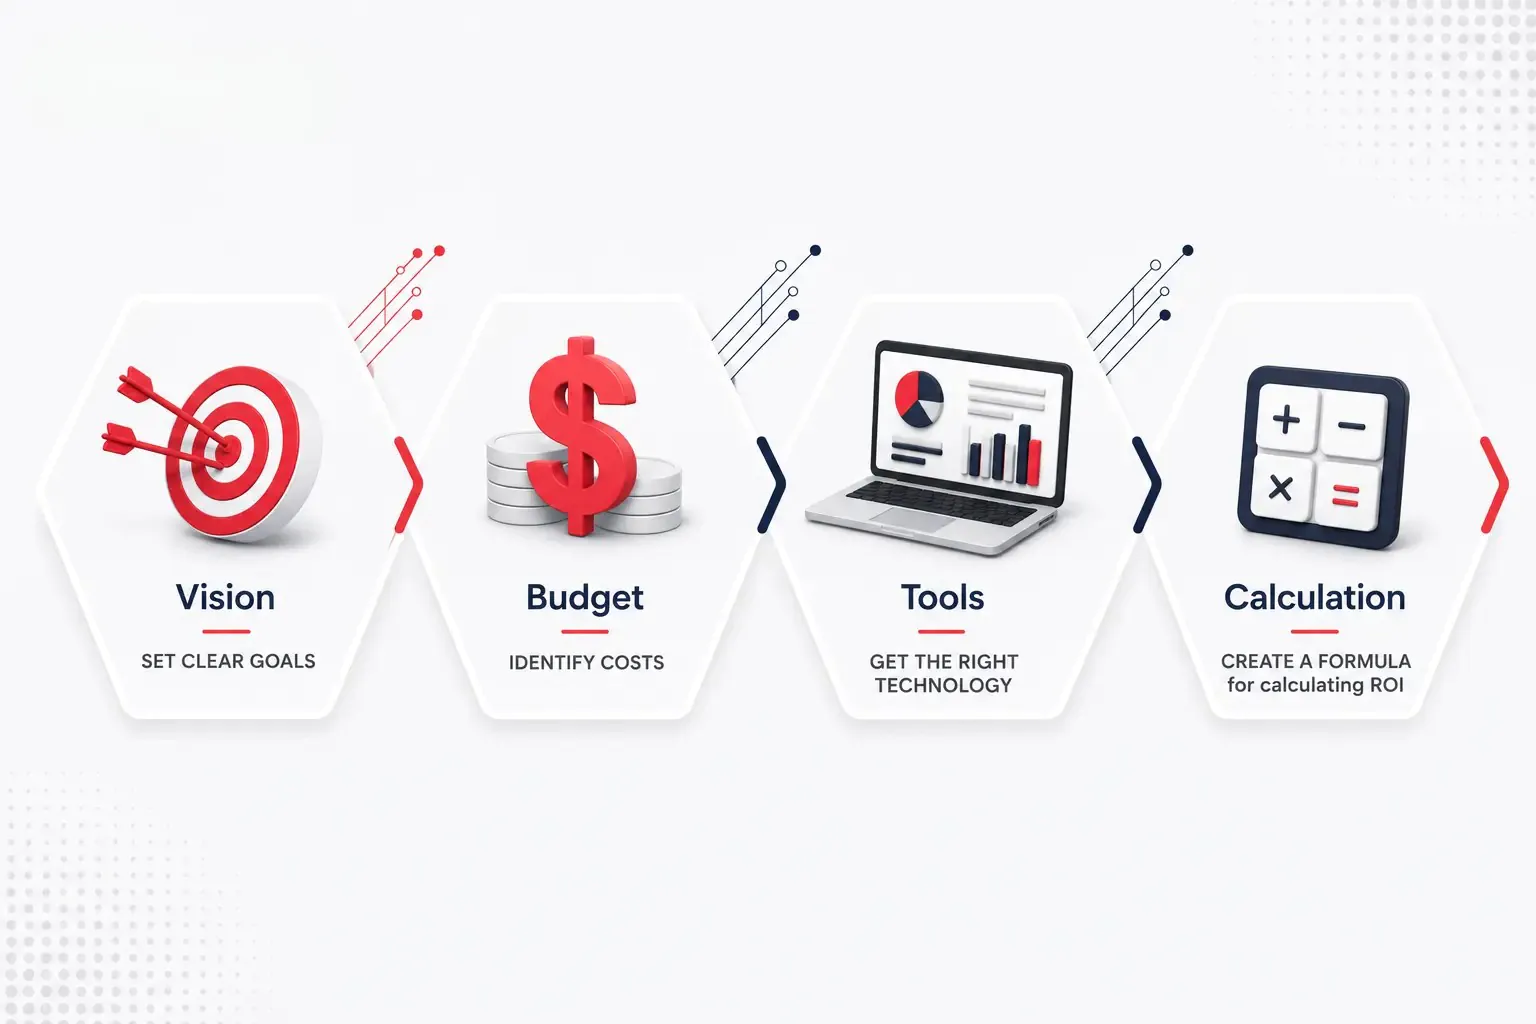
A working content marketing ROI formula requires four inputs: total content program cost, content-influenced revenue, content-sourced revenue, and your organisation’s weighting between them.
Total content program cost should include all direct and indirect costs: content production (internal personnel time at loaded cost, freelance or agency fees), content distribution (paid social promotion, email platform costs, SEO tools), content management (CMS licensing, project management tools), and content analytics (attribution platforms, reporting tools). Many organizations undercount content cost by including only production and excluding distribution and tooling, which produces artificially high ROI figures that do not survive finance scrutiny.
The basic ROI formula is: (Content-Attributed Revenue − Content Program Cost) ÷ Content Program Cost × 100. Applied to content-influenced revenue, this captures the broadest view of content’s contribution. Applied to content-sourced revenue only, it produces a conservative figure that holds up under the most sceptical attribution assumptions.
For a practical example: a content program costing $180,000 annually (including personnel, production, and distribution) that generates $450,000 in content-sourced revenue and $1.2 million in content-influenced revenue produces a sourced ROI of 150% and an influenced ROI of 567%. Both figures are meaningful, the sourced ROI demonstrates content’s ability to independently generate pipeline, while the influenced ROI demonstrates its role in the broader revenue system.
Reporting both figures, with clear definitions of each, gives leadership teams the information to make investment decisions without forcing a single number to represent a program that operates across multiple stages and time horizons.
Content Assets vs. Content Campaigns: Two Different ROI Timelines
One of the most important distinctions in content ROI analysis is between content assets and content campaigns. They have fundamentally different return profiles and should be evaluated on different timelines.
A content asset is a piece of content designed to generate compounding returns over an extended period, a comprehensive guide optimised for search, a pillar page that anchors a topic cluster, an evergreen video tutorial, or a resource that other sites regularly link to. Content assets require higher upfront investment and generate minimal returns in the first 60–90 days, but their return per dollar invested increases over time as organic traffic accumulates. Evaluating a content asset at 90 days and concluding it has poor ROI is equivalent to evaluating a real estate investment after the first mortgage payment.
A content campaign is a time-bounded content initiative designed to support a specific business objective, a product launch, a seasonal promotion, a lead generation push, or a demand generation program tied to a sales cycle. Content campaigns have defined start and end dates, clear conversion objectives, and returns that are largely realized within the campaign window. These should be evaluated on the same timeline as paid campaigns with comparable objectives.
Mixing the two in a single ROI calculation produces confusion. A content program that is 70% asset-building and 30% campaign-based will look underperforming in a quarterly review if the evaluation framework is designed for campaign-pace returns. Separating the two in your reporting, with distinct budgets, distinct metrics, and distinct evaluation timelines, produces accurate performance data for each and prevents the misallocation of resources that follows from conflated measurement.
Building a Sustainable Social Media Engine
Content marketing ROI is ultimately a leadership and systems problem as much as it is a measurement problem. The businesses that measure content returns most accurately have made three organisational decisions that precede any analytics implementation: they treat content as a long-term asset rather than a short-term expense, they invest in attribution infrastructure before scaling content production, and they establish reporting frameworks that communicate content’s value in revenue language rather than marketing language.
The implementation priority for most organizations is: establish UTM discipline and CRM attribution fields first, then define your conversion event taxonomy, then select an attribution model, then build your pillar-level reporting structure. With that infrastructure in place, content ROI measurement becomes a reporting exercise rather than a reverse-engineering project.
Content marketing’s compounding return profile is its greatest strategic advantage over paid channels, and its greatest measurement challenge. A paid ad stops generating returns the moment you stop funding it. A well-constructed piece of content can generate qualified traffic, leads, and revenue for years after the initial production cost is absorbed. That long-term value is real, but it requires a measurement system designed to capture it rather than one designed for channels that operate on a monthly return cycle.
The organisations that will build durable content advantages in the next three years are those that invest in measurement infrastructure now, not because measurement is the goal, but because accurate measurement is what enables confident investment, systematic optimisation, and the compounding returns that make content marketing one of the highest-ROI programs a business can run.
ROI measurement gets significantly easier when the underlying content programme is organised by pillar – making per-theme revenue contribution directly visible, as covered in our content pillars framework guide.