Choosing the Right Framework for Your Funnel
A study by Nielsen found that brands using advanced attribution models improve marketing ROI by an average of 15–20% compared to those relying on last-click measurement alone. That improvement does not come from spending more it comes from reallocating existing budget based on a more accurate picture of what is actually driving conversions. The model you use to attribute credit across your marketing channels is one of the most consequential analytical decisions in your entire marketing program, and most businesses are making it by default rather than by design.
Marketing attribution models are the frameworks that determine how conversion credit is distributed across the touchpoints a customer interacted with before completing a purchase, signing up, or taking another defined action. The model you choose determines which channels appear to be performing well, which appear to be underperforming, and therefore which receive more budget in the next planning cycle. An attribution model is not just a reporting preference, it is a decision engine that shapes every downstream budget allocation.
Last-Click Attribution: Why the Default Is Also the Most Misleading
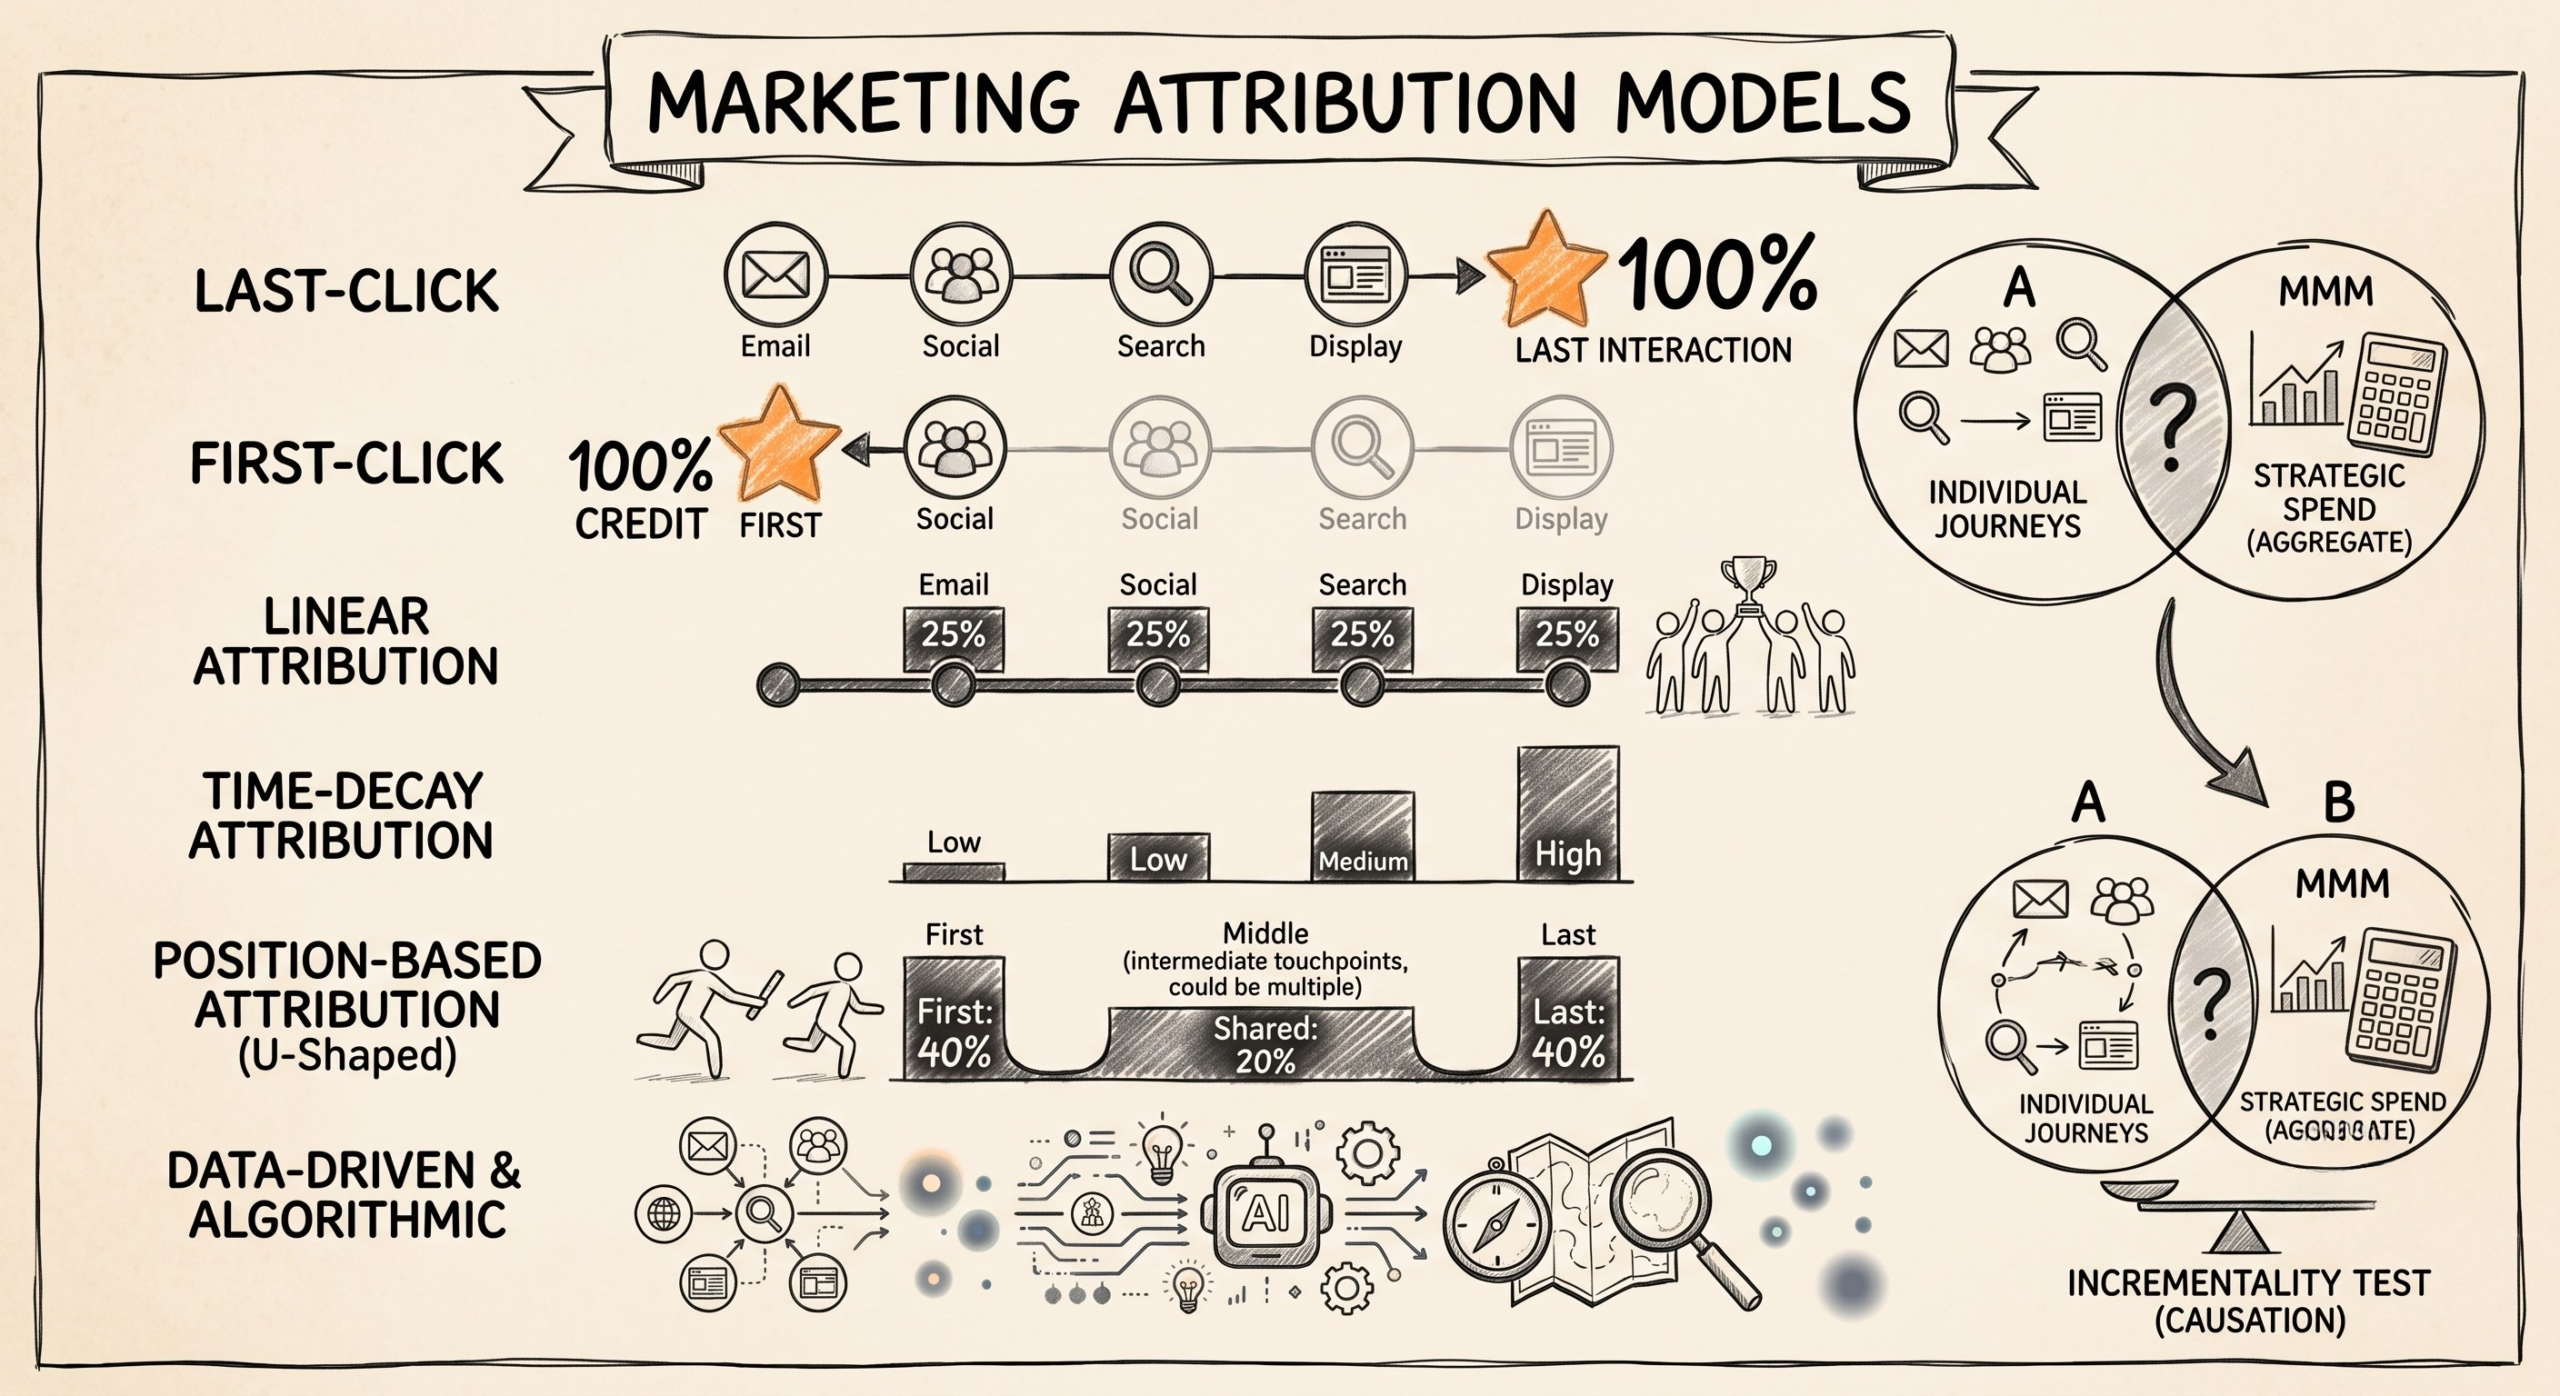
Last-click attribution assigns 100% of conversion credit to the final touchpoint a customer interacted with before converting. It is the default model in Google Analytics (Universal Analytics), most CRM platforms, and many ad platforms’ native reporting, which means it is the model most businesses use without having actively chosen it.
The appeal of last-click is its simplicity: one channel gets the credit, the math is clean, and the reporting is easy to communicate. The problem is that it systematically misrepresents how customers actually make purchase decisions. In most buyer journeys, particularly those involving considered purchases or B2B sales cycles, the final touchpoint is rarely the one that initiated interest, built brand familiarity, or addressed the primary objection that was blocking conversion. It is simply the last step in a journey made possible by multiple touchpoints.
The practical consequence is a consistent pattern of misallocation: paid brand search campaigns receive disproportionate credit because branded searches frequently occur at the end of a journey initiated by content, organic social, or display advertising, channels that disappear from the performance report despite having done the work. Upper-funnel channels that build awareness and consideration are chronically undervalued and underfunded, while bottom-funnel channels that capture existing intent receive budget that would produce better returns if distributed across the full journey.
For businesses where a customer journey involves a single touchpoint, a direct search, an immediate click-through, an immediate purchase, last-click attribution is actually accurate. This describes a small but real segment of transactions, particularly for low-consideration impulse purchases. For any business with a multi-touchpoint customer journey, it is a systematically distorting lens.
First-Click Attribution: The Opposite Distortion
First-click attribution assigns 100% of conversion credit to the first touchpoint a customer interacted with, the channel that initially introduced the brand or generated the first recorded engagement. It is the mirror image of last-click, applying the same binary credit logic to the opposite end of the funnel.
First-click is useful for a specific strategic question: which channels are best at generating new customer awareness and initiating journeys? If your primary marketing objective is top-of-funnel reach, expanding into new audience segments, building brand awareness in a new market, or understanding which discovery channels are feeding your pipeline, first-click attribution highlights which channels are doing that initiation work most effectively.
The limitation is symmetric with last-click: all channels between the first and last touchpoint receive zero credit, making first-click as inaccurate as last-click for businesses trying to evaluate the full contribution of a multi-channel program. Running first-click alongside last-click, comparing how credit distribution shifts between the two, is actually one of the fastest diagnostic tools available for identifying which channels are primarily awareness-building (high first-click share, low last-click share) and which are primarily conversion-capturing (high last-click share, low first-click share). That comparison alone yields actionable clarity on channel roles that inform creative strategy and funnel sequencing.
Linear and Time-Decay Models: Distributed Credit Frameworks
Linear attribution distributes conversion credit equally across every touchpoint in the customer journey. A customer who interacted with a Facebook ad, an organic search result, an email, and a Google retargeting ad before converting would generate a 25% conversion credit assigned to each of those four touchpoints in a linear model.
The logical appeal is fairness: every touchpoint that contributed to the journey receives recognition rather than the binary winner-takes-all logic of single-touch models. The practical limitation is that equal distribution does not reflect the unequal impact that different touchpoints have in most real buying journeys. Treating a brand awareness impression from four months ago with the same credit as a high-intent retargeting click the day before conversion conflates touchpoints of genuinely different commercial significance.
Linear attribution is most appropriate for businesses where the buying journey is genuinely relationship-driven and sequential, professional services, SaaS with long free trial periods, and B2B with multiple stakeholder touchpoints, where every interaction in the journey has a legitimate claim to meaningful credit and no single touchpoint dominates the conversion outcome.
Time-decay attribution addresses linear attribution’s equal-weight limitation by assigning progressively more credit to touchpoints closer to the conversion date, on the assumption that recency correlates with causal influence. A touchpoint occurring one day before conversion receives significantly more credit than one occurring 30 days before, following an exponential decay curve that the marketer can configure. This model most closely matches an intuition that the touchpoints a customer engaged with immediately before purchasing were the most direct causes of that purchase.
Time-decay is most appropriate for businesses with short consideration cycles, where the recency-to-influence correlation is strong, such as flash sales, time-limited offers, and event registrations, in which decisions are made close to the conversion event. It systematically undervalues long-term brand-building activity, which makes it an inappropriate model for businesses where brand equity is a significant driver of eventual conversion months after initial exposure.
Position-Based Attribution: Weighting What Matters Most
Position-based attribution, also called U-shaped attribution, assigns disproportionate credit to the first and last touchpoints while distributing the remaining credit across intermediate touchpoints. The most common implementation assigns 40% credit to the first touchpoint, 40% to the last, and distributes the remaining 20% equally across all touchpoints in between.
The rationale reflects what most marketers intuitively understand: the first touchpoint matters because it initiates the customer relationship and determines whether a journey even begins, the last touchpoint matters because it seals the conversion decision; and the intermediate touchpoints collectively matter because they maintain engagement across the consideration period, but individually less than the bookends. This model produces a more nuanced credit distribution than single-touch models while avoiding the arbitrary equal-weight logic of linear attribution.
Position-based attribution is the most widely recommended marketing attribution model for businesses with moderately complex customer journeys, typically three to seven touchpoints across a consideration period of days to weeks. It is supported natively in Google Analytics 4 as a comparison model, in HubSpot’s attribution reporting, and in most enterprise marketing analytics platforms, making implementation accessible without custom data science investment.
The limitation is that the 40/40/20 split is arbitrary, it reflects a reasonable prior about journey importance distribution rather than empirical evidence about your specific customers’ actual journey dynamics. For businesses with the data volume to support more sophisticated modelling, algorithmic attribution offers a data-driven alternative to the assumption-based weighting of position-based models.
Data-Driven and Algorithmic Attribution: Where AI Changes the Equation
Data-driven attribution (DDA) uses machine learning to analyse the actual conversion patterns in your campaign data and assigns credit to each touchpoint based on its measured contribution to conversion probability, rather than applying a predetermined rule about how credit should be distributed. Google Analytics 4 uses DDA as its default attribution model for accounts with sufficient conversion volume, and Meta’s Ads Manager increasingly uses algorithmic attribution signals to inform its own optimisation decisions.
The mechanism is counterfactual analysis: the algorithm evaluates what would have happened to conversion probability if a specific touchpoint had been absent from the journey. A touchpoint that, when present, significantly increases the probability of conversion receives more credit than one whose presence or absence shows minimal impact on conversion outcomes. This is the closest approximation to actual causal influence that current attribution technology can produce from observational data.
DDA requires sufficient conversion volume to produce reliable models, Google’s threshold is approximately 400 conversions per month across tracked channels, with at least 3,000 ad interactions. Below these thresholds, the machine learning model has insufficient data to distinguish signal from noise, and the model defaults to position-based attribution. For businesses with lower conversion volume, DDA is not yet a practical option, making position-based the highest-quality available alternative.
The significant limitation of DDA is that it only analyses the data it has access to, which means touchpoints in channels not connected to your attribution system are invisible to the model. A customer who saw a YouTube pre-roll ad, heard a podcast sponsorship, and received a direct mail piece before converting through a paid search click has a journey that DDA would represent as a single-touchpoint search conversion, because the offline and YouTube touchpoints may not feed the attribution system with sufficient signal. The quality of DDA output is exactly proportional to the completeness of your cross-channel tracking infrastructure.
Marketing Mix Modelling: The Measurement Approach Attribution Models Cannot Replace
Marketing attribution models, whether last-click, position-based, or data-driven, share a fundamental constraint: they can only attribute credit to touchpoints that left a measurable digital trace. Television advertising, out-of-home placements, radio, print, and word-of-mouth referrals do not generate trackable clicks or impressions that feed into attribution systems. For brands operating across both digital and traditional channels, attribution model-based measurement is structurally incomplete.
Marketing Mix Modelling (MMM) addresses this gap by using statistical regression analysis to quantify the contribution of every marketing input, including unmeasurable channels, to business outcomes across a defined time period. Rather than tracking individual customer journeys, MMM analyses aggregate patterns in spend and revenue data to model the marginal contribution of each marketing channel to total sales volume. It can capture the revenue lift from a television campaign, a seasonal outdoor advertising burst, or a PR-driven media cycle that attribution models entirely miss.
The tradeoff is resolution: MMM produces channel-level insights at a weekly or monthly aggregate level, making it useful for strategic budget allocation decisions but not for tactical campaign optimisation at the ad set or keyword level. Most sophisticated marketing measurement programs use both approaches in parallel, attribution models for tactical digital optimisation decisions and MMM for portfolio-level budget allocation across digital and traditional channels simultaneously. Google’s Meridian and Meta’s Robyn are open-source MMM frameworks that have made this methodology more accessible to mid-market brands without requiring expensive proprietary modelling platforms.
Incrementality Testing: The Ground Truth Attribution Cannot Provide
Every attribution model, including data-driven, shares a fundamental limitation: it measures correlation between touchpoints and conversions, not causation. A channel that consistently appears in the last position before conversion may be capturing intent that would have converted anyway through another channel, generating attributed credit without actually generating incremental revenue.
Incrementality testing, also called lift testing or holdout testing, is the methodology that measures true causal impact. A defined segment of your audience is placed in a holdout group that does not receive a specific campaign or channel exposure; the conversion rate of the holdout group is compared against the conversion rate of the exposed group to calculate the actual lift attributable to the marketing activity. The difference between the two groups’ conversion rates, controlling for other variables, represents the genuine incremental impact of the campaign.
Meta Ads Manager, Google Ads, and most enterprise ad platforms offer native incrementality test infrastructure. Running a quarterly incrementality test for each of your primary paid channels produces a multiplier, your actual incremental ROAS relative to platform-reported ROAS, which reframes your understanding of which channels are genuinely driving new conversions versus capturing intent that would have converted regardless. Brands consistently running incrementality tests report that some channels generating strong attributed ROAS show modest incremental lift, while channels with modest attributed ROAS sometimes show strong incrementality, a finding that would be invisible to any attribution model alone.
Choosing and Implementing the Right Attribution Framework
The appropriate marketing attribution model for your business is determined by three factors: your customer journey length and complexity, your conversion volume, and the channels your customers move through before purchasing.
For businesses with simple, predominantly single-channel journeys and low conversion volume, last-click or first-click provides sufficient signal for the optimisation decisions being made. For businesses with multi-touchpoint journeys across three to six digital channels and moderate conversion volume (100–400 conversions per month), position-based attribution represents the best accuracy-to-complexity trade-off. For businesses with high conversion volume (400+ per month), substantial cross-channel digital investment, and the technical infrastructure to connect all channels to a unified measurement system, data-driven attribution produces the most accurate credit distribution available from observational data.
The infrastructure prerequisite for any multi-touch attribution model is consistent UTM parameter tagging across every paid and owned channel, ensuring every traffic source that drives visits is tagged with source, medium, campaign, and content parameters that the attribution system can read. Without this, multi-touch models aggregate untagged traffic into a “direct” or “none” source category that absorbs credit from the channels that actually drove it.
The Strategic Priority for Marketers
Marketing attribution models are not measurement tools, they are decision frameworks that determine how your organisation allocates resources across channels, evaluates campaign performance, and builds the marketing program over time. The model you use by default is almost certainly distorting at least some of your budget allocation decisions, even if the individual channel metrics it produces look reasonable in isolation.
The implementation priority for most marketing teams is: audit which attribution model your current analytics platform is using and whether it was chosen deliberately; run a parallel comparison of last-click against position-based attribution in Google Analytics 4 to identify which channels are most significantly under-credited by last-click; implement consistent UTM tagging across all channels to ensure multi-touch models have complete data to work from; and add a quarterly incrementality test for your highest-spend paid channel to validate whether platform-reported attribution aligns with actual incremental business impact.
The direction of attribution is toward privacy-resilient, AI-assisted measurement, as third-party cookie data continues to diminish, the brands that have invested in first-party data infrastructure, server-side tracking, and MMM alongside touchpoint attribution will be best positioned to maintain measurement accuracy as the tracking environment continues to evolve.